Zoho Analytics, a robust business intelligence and analytics platform, plays a pivotal role in empowering businesses to unlock the full potential of their data. With its intuitive interface, powerful features, and comprehensive capabilities, Zoho Analytics enables users to analyze data, visualize trends, generate interactive reports, and derive actionable insights, ultimately contributing to business success. This article is designed to provide a deep dive into the realm of Zoho Analytics, exploring its key features, benefits, pricing options, use cases, and integration capabilities.

- Data Connectivity: Logi Analytics provides robust data connectivity options, allowing organisations to connect to a wide range of data sources, including databases, web services, and APIs. The platform supports both on-premises and cloud-based data sources, enabling real-time data analysis.
- Advanced Analytics: Logi Analytics provides advanced analytics capabilities, including predictive modelling, data segmentation, trend analysis, and forecasting. Users can apply statistical algorithms and machine learning techniques to uncover patterns, identify trends, and make data-driven predictions.
- Embedded Analytics: Logi Analytics excels in embedded analytics, allowing organisations to seamlessly integrate analytics into their applications, products, or websites. The platform provides SDKs, APIs, and customization options to ensure a seamless user experience and consistent branding.
- Security and Access Control: Logi Analytics offers robust security features to protect sensitive data. Organisations can implement user authentication, role-based access control, and data encryption to ensure data privacy and compliance with regulatory requirements.
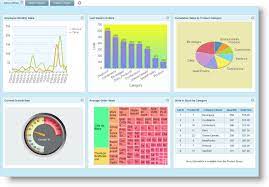
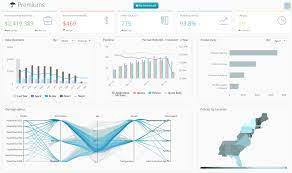
Users can easily drag and drop visual elements onto the dashboard canvas and arrange them as desired. Logi Analytics supports interactive features such as filtering, drill-down, and drill-through, allowing users to explore data in more detail and gain deeper insights.
The platform also provides options for customization, including the ability to apply branding, themes, and styling to match the organisation’s visual identity. Users can create personalised dashboards for different user roles or departments, ensuring that each user sees the most relevant information.
Users are guided through step-by-step instructions on how to design and build interactive dashboards, create data visualisations using Logi Analytics’ drag-and-drop interface, and apply advanced analytics techniques such as data segmentation, predictive modelling, and forecasting.
The tutorials also cover best practices for data modelling, security configurations, and performance optimization to ensure users can make the most of Logi Analytics’ capabilities. The documentation provides detailed information on each feature and functionality, allowing users to explore and leverage the platform’s full potential.
To obtain accurate pricing information, it is recommended to contact the Logi Analytics sales team directly. They can provide detailed pricing based on the specific requirements and scale of your organisation.
Users appreciate the intuitive and interactive nature of the platform, enabling them to easily explore and analyse data. The drag-and-drop interface allows for effortless creation of visually compelling dashboards and reports, even for users with limited technical expertise. The platform’s robust security features and seamless integration with Oracle’s suite of products contribute to its positive reputation.
Furthermore, users command Oracle Analytics Cloud for its scalability, enabling organisations to handle large volumes of data and support growing analytics requirements. The platform’s ability to handle both structured and unstructured data, combined with its advanced analytics capabilities, empowers users to derive valuable insights and make informed business decisions.

Logi Analytics, a prominent embedded analytics platform, equips organizations with tools to create interactive dashboards, reports, and visualizations that facilitate informed decision-making. This article will delve into various facets of Logi Analytics, encompassing essential elements such as pricing, reviews, tutorials, dashboard capabilities, features, data analytics functionalities, the implementation process, available training options, a comparative analysis with Tableau, and insights into the download process.
Comparing Logi Analytics to Tableau allows organisations to understand the differences between the two platforms and choose the most suitable solution for their analytics needs. While both platforms offer powerful analytics capabilities, there are notable distinctions:
Embedded Analytics Focus: Logi Analytics specialises in embedded analytics, providing organisations with the tools to seamlessly integrate analytics into their applications, products, or websites. Tableau, on the other hand, focuses on standalone analytics solutions for data visualisation and analysis.
Data Connectivity: Both Logi Analytics and Tableau support a wide range of data connectors, allowing organisations to integrate data from various sources. Logi Analytics offers more flexibility in terms of data connectivity options, including support for on-premises and cloud-based data sources.
User Interface and Ease of Use: Tableau is known for its intuitive and user-friendly interface, enabling users of varying technical backgrounds to create interactive visualisations and explore data. Logi Analytics also provides a user-friendly interface but focuses more on empowering developers and embedding analytics into applications.
Pricing Model: Logi Analytics offers flexible pricing options tailored to the specific needs of organisations. Tableau’s pricing structure is based on a per-user or per-server basis. Organisations should consider their budget and specific requirements when evaluating the pricing models of both platforms.
Understanding the pricing, reviewing the platform’s capabilities, exploring tutorials and training options, and comparing it to other analytics solutions like Tableau can help organisations make informed decisions regarding the adoption of Logi Analytics. Whether it’s implementing Logi Analytics, training users, or customising dashboards, Logi Analytics provides the necessary tools and resources for organisations to succeed in their analytics journey.
Mode Analytics, developed by Mode Analytics Inc., stands out as a robust analytics solution that empowers users to efficiently explore, analyze, and visualize data. This article aims to comprehensively explore various dimensions of Mode Analytics, encompassing crucial elements such as pricing, reviews, tutorials, dashboard capabilities, features, data visualization capabilities, the implementation process, available training options, a comparative analysis with Tableau, and insights into the download process.
Datorama, a marketing intelligence platform, provides a comprehensive solution to help organizations integrate, analyze, and visualize their marketing data. This article offers an exploration of various facets of Datorama, encompassing critical aspects such as pricing, reviews, tutorials, dashboard capabilities, features, data analytics functionalities, the implementation process, available training options, a comparative analysis with Tableau, and insights into the download process.


