Zoho Analytics, a robust business intelligence and analytics platform, plays a pivotal role in empowering businesses to unlock the full potential of their data. With its intuitive interface, powerful features, and comprehensive capabilities, Zoho Analytics enables users to analyze data, visualize trends, generate interactive reports, and derive actionable insights, ultimately contributing to business success. This article is designed to provide a deep dive into the realm of Zoho Analytics, exploring its key features, benefits, pricing options, use cases, and integration capabilities.

- SQL Editor: Mode Analytics provides a powerful SQL editor that allows users to write and execute SQL queries seamlessly. The editor supports syntax highlighting, code suggestions, and error checking, making it easier for users to write complex queries.
- Data Transformation: Mode Analytics offers a range of data transformation capabilities, enabling users to clean, reshape, and aggregate data. Users can perform data manipulations,such as filtering, joining, and pivoting, to prepare data for analysis.
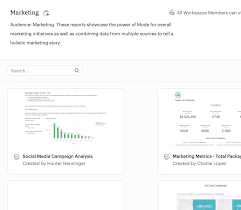
- Collaboration and Sharing: Mode Analytics emphasises collaboration, allowing multiple users to work on projects simultaneously. Users can share queries, reports, and dashboards with team members and stakeholders, facilitating knowledge sharing and decision-making.
- Version Control: The platform provides version control functionality, enabling users to track changes made to queries and analysis over time. This feature enhances collaboration and ensures data integrity.
- Scheduled Reporting: Mode Analytics allows users to schedule and automate the delivery of reports and dashboards. Users can set up recurring reports to be sent to specific recipients, ensuring stakeholders have access to the latest insights.
- Data Governance and Security: Mode Analytics prioritises data governance and security. The platform provides granular access controls, allowing administrators to manage user permissions and restrict access to sensitive data. Data encryption and compliance with industry security standards further ensure data protection.
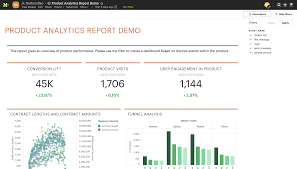
The platform provides a variety of visualisation options, including charts, graphs, tables, and maps. Users can customise these visualisations by selecting different colours, fonts, and styles to align with their branding or reporting requirements. The drag-and-drop interface enables easy arrangement and organisation of visual elements within the dashboard.
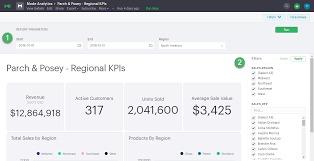
Mode Analytics dashboards are highly interactive, enabling users to filter data, drill down into specific dimensions, and perform ad-hoc analysis. Users can add interactive controls, such as dropdowns or sliders, to allow viewers to explore the data themselves. This interactivity enhances the user experience and facilitates data exploration.
The tutorial covers fundamental concepts, such as connecting data sources, writing SQL queries, and creating visualisations. Users learn how to import and transform data, perform complex data manipulations, and generate insights through visualisations and reports.
Additionally, the tutorial delves into advanced topics, including statistical analysis, modelling, and sharing results with stakeholders. Users gain a deeper understanding of the platform’s capabilities and how to apply them to their specific business needs.
Mode Analytics provides tiered pricing based on the number of users, the amount of data processed, and the desired features and capabilities. Organisations can choose between monthly or annual subscriptions based on their requirements. Additionally, Mode Analytics offers customised enterprise pricing plans for larger organisations with specific needs.
For accurate pricing information, it is recommended to contact Mode Analytics directly. Their sales representatives can provide detailed pricing based on the specific needs and scale of your organisation.
Users appreciate the platform’s ease of use, allowing both technical and non-technical users to navigate and analyse data efficiently. The intuitive interface, coupled with a robust SQL editor, enables users to write complex queries and perform advanced analytics seamlessly.
Furthermore, Mode Analytics provides strong collaboration features, allowing users to work together on data analysis projects. The platform supports version control, commenting, and sharing functionalities, enabling teams to collaborate effectively and share insights with stakeholders.

Mode Analytics, developed by Mode Analytics Inc., stands out as a robust analytics solution that empowers users to efficiently explore, analyze, and visualize data. This article aims to comprehensively explore various dimensions of Mode Analytics, encompassing crucial elements such as pricing, reviews, tutorials, dashboard capabilities, features, data visualization capabilities, the implementation process, available training options, a comparative analysis with Tableau, and insights into the download process.
A comparison between Mode Analytics and Tableau, another leading data visualisation and analytics tool, can help organisations make an informed decision based on their specific requirements. While both platforms offer powerful analytics capabilities, there are notable differences:
Pricing and Licensing: Mode Analytics offers flexible pricing options based on factors such as the number of users, data volume, and desired features. Tableau, on the other hand, provides various pricing plans, including both subscription and perpetual licensing options. The exact pricing for both platforms depends on the organisation’s needs and scale.
Data Source Connectivity: Both Mode Analytics and Tableau support a wide range of data sources, including databases, spreadsheets, and cloud platforms. However, Tableau offers a larger ecosystem of native connectors, making it easier to connect to various data sources out of the box.
Advanced Analytics Capabilities: Tableau provides a comprehensive set of advanced analytics features, including predictive analytics, statistical modelling, and machine learning integration. While Mode Analytics offers SQL-based calculations and data manipulation, Tableau has a broader range of advanced analytics capabilities.
Collaboration and Sharing: Mode Analytics offers robust collaboration features, allowing multiple users to work together on projects. Users can share queries, analyses, and dashboards with team members. Tableau also provides collaboration capabilities, including sharing and commenting, enabling teams to collaborate effectively.
Logi Analytics, a prominent embedded analytics platform, equips organizations with tools to create interactive dashboards, reports, and visualizations that facilitate informed decision-making. This article will delve into various facets of Logi Analytics, encompassing essential elements such as pricing, reviews, tutorials, dashboard capabilities, features, data analytics functionalities, the implementation process, available training options, a comparative analysis with Tableau, and insights into the download process.
Datorama, a marketing intelligence platform, provides a comprehensive solution to help organizations integrate, analyze, and visualize their marketing data. This article offers an exploration of various facets of Datorama, encompassing critical aspects such as pricing, reviews, tutorials, dashboard capabilities, features, data analytics functionalities, the implementation process, available training options, a comparative analysis with Tableau, and insights into the download process.


