
Zoho Analytics, a robust business intelligence and analytics platform, plays a pivotal role in empowering businesses to unlock the full potential of their data. With its intuitive interface, powerful features, and comprehensive capabilities, Zoho Analytics enables users to analyze data, visualize trends, generate interactive reports, and derive actionable insights, ultimately contributing to business success. This article is designed to provide a deep dive into the realm of Zoho Analytics, exploring its key features, benefits, pricing options, use cases, and integration capabilities.
About TIBCO Spotfire
Featured Images
Birst features
- Data Connectivity: Birst enables users to connect to a wide range of data sources, including databases, spreadsheets, cloud-based services, and enterprise applications. Users can blend data from multiple sources to create a unified view for analysis.
- Data Preparation: Birst provides intuitive data preparation capabilities, allowing users to transform, cleanse, and enrich data before analysis. Users can perform tasks such as data cleansing, data modelling , data blending, and data quality management.
- Self-Service Analytics: Birst's self-service analytics capabilities enable business users to explore data, create ad hoc queries, and generate interactive visualisations without relying on IT or data analysts. This empowers business users to gain insights and make data-driven decisions.
- Advanced Analytics: Birst offers advanced analytics capabilities, including statistical analysis, predictive modelling , and forecasting. Users can leverage these features to identify trends, predict outcomes, and make data-driven forecasts.
- Collaborative Sharing: Birst provides collaboration features that enable users to share insights, dashboards, and reports with colleagues and stakeholders. Users can schedule and distribute reports via email, embed dashboards in other applications, and foster collaboration through data-driven discussions.
- Mobile Access: Birst's mobile app allows users to access dashboards and reports on-the-go. Users can view and interact with visualisations, explore data, and stay informed about key business metrics from their mobile devices.
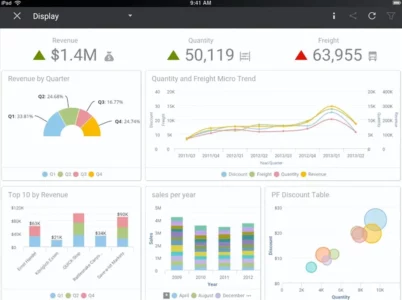
Birst Dashboard
Users can select from a variety of visualisation components, including charts, graphs, tables, and maps, to build interactive and visually appealing dashboards. Birst’s dashboard features allow users to drill down into data, apply filters, and create dynamic visualisations that respond to user interactions.
Birst Tutorial
Users are guided through step-by-step instructions on how to connect to data sources, build data models, perform data transformations, and create interactive dashboards. The tutorials also cover advanced topics such as data blending, creating calculated measures, and leveraging advanced analytics capabilities within Birst.
Pricing
To obtain accurate pricing information, it is recommended to contact the Birst sales team directly. They can provide detailed pricing based on the specific requirements and scale of your organisation.
Birst Implementation
- Requirement Analysis: organisations need to identify their specific business requirements and use cases for Birst. This includes understanding the types of data to be analysed, the desired outcomes, and the existing infrastructure and systems.
- Data Integration: Birst supports a wide range of data integration options, allowing users to connect to various data sources and import data into the platform. Users need to configure data connectors, establish data pipelines, and ensure data quality and integrity.
- Data modelling : Birst’s data modelling capabilities enable users to create logical data models that define relationships and hierarchies between data elements. This step involves mapping data sources, defining dimensions and measures, and creating calculated fields.
- Dashboard and Report Design: Users can design interactive dashboards and reports using Birst’s intuitive interface. This includes selecting appropriate visualisations, arranging components, and applying filters and interactivity to enhance user experience.
- Security and Governance: Birst provides robust security and governance features to ensure data privacy, compliance, and access control. organisations need to define security roles, manage user permissions, and establish data governance policies.
- Testing and Validation: Before deploying Birst to end-users, organisations should thoroughly test and validate the dashboards, reports, and data models. This step ensures data accuracy, functionality, and performance.
- Deployment and User Training: Once validated, Birst can be deployed to end-users, and organisations can provide training and support to ensure users are proficient in utilising the platform’s capabilities effectively.
Birst
Birst, positioned as a prominent cloud-based business intelligence and analytics platform, furnishes organizations with the essential capabilities to analyze, visualize, and share data, facilitating informed decision-making based on data-driven insights. This comprehensive article endeavors to shed light on various dimensions of Birst, encompassing aspects such as pricing considerations, a critical review, tutorial resources, dashboard capabilities, feature highlights, data analytics prowess, implementation methodologies, available training avenues, a comparative analysis with Tableau, and insights into the download processes.
Birst comparisons
Comparing Birst with Tableau, another popular business intelligence and analytics platform, can help organisations make informed decisions based on their specific requirements. Here are some key points of comparison:
Data Connectivity: Both Birst and Tableau support a wide range of data sources and offer connectivity options to import and blend data from multiple sources.
Visualisation Capabilities: Tableau is renowned for its powerful and interactive visualisation capabilities, providing a wide array of visual components and customisation options. Birst also offers strong visualisation capabilities, but it may not provide the same level of flexibility and depth as Tableau in terms of visual customisation .
Self-Service Analytics: Both Birst and Tableau offer self-service analytics features that empower business users to explore data and create visualisations without heavy reliance on IT or data analysts. However, Tableau’s user-friendly interface and drag-and-drop functionality may be more intuitive for non-technical users.
Advanced Analytics: Birst and Tableau both provide advanced analytics capabilities, including predictive modelling and forecasting. However, Birst’s advanced analytics features may be more focused on data preparation and modelling, while Tableau emphasises data visualisation and storytelling.
Scalability: Birst is a cloud-based platform that offers scalability and flexibility, allowing organisations to handle large volumes of data and support a growing number of users. Tableau offers both on-premises and cloud deployment options, providing flexibility for organisations with specific infrastructure requirements.
Pricing Model: Birst’s pricing model is based on factors such as the number of users, functionality requirements, and deployment options. Tableau’s pricing structure primarily revolves around a per-user or per-server basis. organisations should evaluate their specific needs and budget when considering the pricing models of both platforms.
Add a Review to This Software
Conclusion
Understanding Birst’s pricing, reviewing its capabilities, exploring tutorials and training options, comparing it with other analytics solutions like Tableau, and downloading the platform are crucial steps for organisations considering the adoption of Birst. Whether it’s implementing Birst, training users, building interactive dashboards, or leveraging advanced analytics, Birst provides the necessary tools and resources to drive data-driven decision-making and propel organisations towards success.
Alternative Software
Mode Analytics, developed by Mode Analytics Inc., stands out as a robust analytics solution that empowers users to efficiently explore, analyze, and visualize data. This article aims to comprehensively explore various dimensions of Mode Analytics, encompassing crucial elements such as pricing, reviews, tutorials, dashboard capabilities, features, data visualization capabilities, the implementation process, available training options, a comparative analysis with Tableau, and insights into the download process.
Logi Analytics, a prominent embedded analytics platform, equips organizations with tools to create interactive dashboards, reports, and visualizations that facilitate informed decision-making. This article will delve into various facets of Logi Analytics, encompassing essential elements such as pricing, reviews, tutorials, dashboard capabilities, features, data analytics functionalities, the implementation process, available training options, a comparative analysis with Tableau, and insights into the download process.


