Zoho Analytics, a robust business intelligence and analytics platform, plays a pivotal role in empowering businesses to unlock the full potential of their data. With its intuitive interface, powerful features, and comprehensive capabilities, Zoho Analytics enables users to analyze data, visualize trends, generate interactive reports, and derive actionable insights, ultimately contributing to business success. This article is designed to provide a deep dive into the realm of Zoho Analytics, exploring its key features, benefits, pricing options, use cases, and integration capabilities.
About ClicData
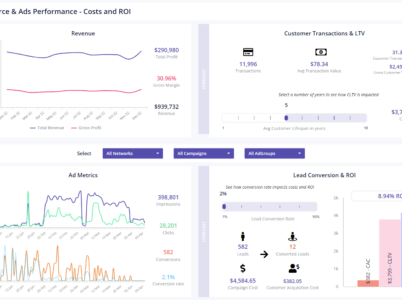
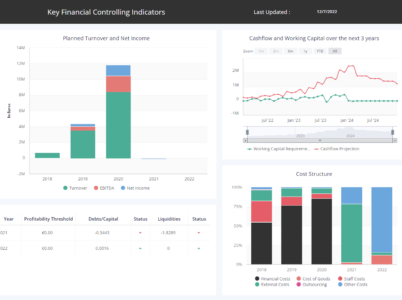
Featured Images
ClicData features
- Interactive Dashboards: ClicData allows users to build dynamic dashboards by simply dragging and dropping data elements onto a canvas. With a vast library of widgets, charts, and graphs, users can create visually appealing and interactive dashboards that provide real-time insights.
- Data Connectivity: ClicData supports connectivity with various data sources, including spreadsheets, databases, cloud services, and popular applications like Salesforce, Google Analytics, and more. This ensures that users can easily access and analyze data from multiple sources within a single platform.
- Data Transformation and Modeling: With ClicData, users can perform advanced data transformations, including cleansing, merging, and aggregating data. The platform also offers data modeling capabilities, enabling users to create relationships, define calculations, and apply business rules to derive valuable insights from complex data sets.
- Collaboration and Sharing: ClicData facilitates collaboration among team members by allowing users to share dashboards, reports, and data sets securely. It supports role-based access controls, ensuring that the right individuals have access to the right information, fostering data-driven decision-making across the organization.
- ClicData data analytics : ClicData offers automated data refresh capabilities, ensuring that dashboards and reports are always up to date. Additionally, users can set up alerts and notifications to be notified of important data changes or specific metrics exceeding predefined thresholds.
ClicData Alternatives
- Tableau: Tableau is a leading data visualization and analytics platform known for its robust features and extensive community support. It offers powerful data exploration and visualization capabilities, making it a popular choice for data-driven organizations. However, Tableau can be more complex and requires a steeper learning curve compared to ClicData.
- Power BI: Microsoft Power BI is another widely used data analytics and visualization tool. With its seamless integration with Microsoft products and services, Power BI offers strong capabilities for data exploration, modeling, and reporting. It provides a comprehensive suite of features for both business users and data professionals.
- QlikView: QlikView is a self-service business intelligence tool that enables users to create interactive dashboards and perform ad-hoc analysis. It offers a unique associative data model, allowing users to explore data intuitively and uncover hidden insights. QlikVi
Who Is ClicData For?
- Small and Medium-sized Businesses: ClicData is an ideal choice for small and medium-sized businesses that want to leverage data analytics but may have limited resources or technical expertise. Its user-friendly interface and affordable pricing make it accessible and attainable for organizations with budget constraints.
- Data Analysts and Business Users: ClicData empowers data analysts and business users to easily explore and analyze data without relying heavily on IT departments or data specialists. The platform’s intuitive dashboard builder and drag-and-drop functionality enable users to create compelling visualizations and reports, making data analysis more accessible to a broader audience.
- Sales and Marketing Teams: ClicData offers valuable insights for sales and marketing teams by consolidating data from various sources, such as CRM systems, social media platforms, and advertising campaigns. By visualizing key performance indicators (KPIs) and metrics in real-time dashboards, these teams can track their progress, identify trends, and make data-driven decisions to optimize their strategies.
Pricing
500.00 / month
- Business Plan
Details:
Base plan : starts at $500 USD per month billed annually<br />
Options plan : customize your plan with add-ons<br />
3,000.00 / month
- Enterprise Subscription Plan
Details:
Base plan : starts at $3,000 USD per month billed annually<br />
Options plan : customize your plan with add-ons
6,000.00 / month
- Platinum Subscription Plan
Details:
Base plan : starts at $6,000 USD per month billed annually<br />
Options plan : customize your plan with add-ons
Why Choose ClicData?
- User-Friendly Interface: ClicData’s intuitive drag-and-drop interface makes it accessible to users of all skill levels. It eliminates the need for complex coding or technical expertise, allowing business users to focus on analyzing data and extracting valuable insights.ClicData download is also a very easy and quick process.
- Versatility and Integration: With its extensive library of connectors and seamless integration capabilities, ClicData offers versatility in accessing and analyzing data from various sources. Whether it’s spreadsheets, databases, or cloud services, ClicData ensures that users can work with their preferred data sources effortlessly.
- Scalability: ClicData is designed to scale with the evolving needs of businesses. From small startups to large enterprises, the platform can handle large volumes of data and accommodate increasing user demands without compromising performance.
ClicData
In today's era dominated by data, businesses across various scales are increasingly realizing the pivotal role of data analytics in making well-informed decisions and gaining a competitive advantage. However, navigating the complexities of harnessing data can be an overwhelming task without the right tools and resources. This is precisely where ClicData steps in to simplify the process.
ClicData comparisons
When comparing ClicData and Tableau, it’s important to consider the specific needs and requirements of your organization. Here are some key points of comparison:
- User-Friendliness: ClicData stands out for its user-friendly interface and intuitive drag-and-drop functionality, making it accessible to users of all skill levels. Tableau, while powerful, may have a steeper learning curve and require more technical expertise.
- Data Connectivity: Both ClicData and Tableau offer extensive data connectivity options. ClicData supports a wide range of data sources, including cloud services and popular applications. Tableau also provides robust connectivity but may require additional configurations for certain data sources.
- Pricing: ClicData offers flexible pricing plans with transparent costs, making it more affordable for small to medium-sized businesses. Tableau, on the other hand, tends to be pricier, especially for larger organizations or enterprise-level deployments.
- Visualization Capabilities: Both ClicData and Tableau excel in visualizing data and creating interactive dashboards. Tableau is known for its extensive range of visualization options and advanced features, providing users with more flexibility in creating complex visualizations. ClicData offers a user-friendly interface with a wide selection of pre-built widgets and templates, making it easier for users to create visually appealing dashboards.
- Learning Resources and Community Support: Tableau has a vast and active user community, offering extensive learning resources, forums, and online tutorials. It also provides comprehensive training programs and certifications. ClicData offers support through documentation, ClicData tutorial, and customer support channels, but its community resources may not be as extensive as Tableau’s.
Add a Review to This Software
Conclusion
While Tableau remains a leading player in the data analytics market, ClicData offers a user-friendly alternative with competitive features and pricing. Ultimately, the choice between the two depends on the specific needs, budget, and technical proficiency of the organization.
With its emphasis on intuitive dashboard creation, data connectivity, and affordability, ClicData is a valuable tool for businesses seeking to unlock the potential of their data and make data-driven decisions. By leveraging ClicData’s powerful features and functionalities, organizations can gain valuable insights, enhance collaboration, and stay ahead in today’s data-driven landscape.
Alternative Software
Mode Analytics, developed by Mode Analytics Inc., stands out as a robust analytics solution that empowers users to efficiently explore, analyze, and visualize data. This article aims to comprehensively explore various dimensions of Mode Analytics, encompassing crucial elements such as pricing, reviews, tutorials, dashboard capabilities, features, data visualization capabilities, the implementation process, available training options, a comparative analysis with Tableau, and insights into the download process.
Logi Analytics, a prominent embedded analytics platform, equips organizations with tools to create interactive dashboards, reports, and visualizations that facilitate informed decision-making. This article will delve into various facets of Logi Analytics, encompassing essential elements such as pricing, reviews, tutorials, dashboard capabilities, features, data analytics functionalities, the implementation process, available training options, a comparative analysis with Tableau, and insights into the download process.


