Zoho Analytics, a robust business intelligence and analytics platform, plays a pivotal role in empowering businesses to unlock the full potential of their data. With its intuitive interface, powerful features, and comprehensive capabilities, Zoho Analytics enables users to analyze data, visualize trends, generate interactive reports, and derive actionable insights, ultimately contributing to business success. This article is designed to provide a deep dive into the realm of Zoho Analytics, exploring its key features, benefits, pricing options, use cases, and integration capabilities.
About Google Data Studio
Featured Images
Google Data Studio features
- Integration: Google Data Studio offers seamless integration with other Google products and services, enabling users to leverage the full potential of their data ecosystem. Integration with Google Drive allows users to save and share reports directly from Google Data Studio.
- Training: The Google Data Studio Help Center serves as a valuable resource, providing documentation, tutorials, and guides on different topics related to the platform. Users can access step-by-step instructions, video tutorials, and best practic
- Interactive Dashboards: TIBCO Spotfire provides a drag-and-drop interface to create interactive dashboards and reports. Users can customise their visualisations, add filters, and create dynamic interactions to explore data and gain insights.
- Template: To streamline the report creation process, Google Data Studio provides a gallery of templates that users can leverage. These templates offer pre-designed layouts, visualisations, and styles that users can customise to match their data and reporting requirements.
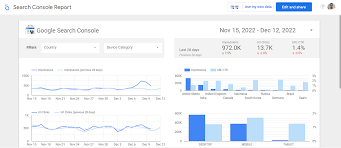
Google Data Studio Dashboard
The platform provides a wide range of visualisation options, including charts, tables, maps, and scorecards. Users can customise these visualisations with different colours, fonts, and styles to align with their branding or reporting requirements. The drag-and-drop interface enables easy arrangement and resizing of visual elements within the dashboard.
Google Data Studio dashboards are highly interactive, allowing users to apply filters, slicers, and date ranges to explore data in real-time. Users can also add interactivity features like clickable images, drill-down options, and dynamic controls to provide a richer user experience.
Google Data Studio Download
As a cloud-based solution, Google Data Studio offers the advantage of real-time collaboration and automatic updates. Users can access their reports and dashboards from anywhere with an internet connection, and changes made by one user are reflected instantaneously for others.
Pricing
The best part about Google Data Studio is that it is completely free to use. There are no upfront costs or subscription fees associated with the platform. Users can create and share reports without any additional charges.
Connectors in Google Data Studio
The platform offers a range of native connectors for popular Google products such as Google Analytics, Google Ads, Google Sheets, and BigQuery. Additionally, Google Data Studio provides connectors for popular third-party data sources like Salesforce, MySQL, PostgreSQL, and YouTube.
The connectors in Google Data Studio facilitate real-time data updates, ensuring that reports and dashboards always reflect the latest information. Users can schedule data refreshes or set up automatic refresh intervals to keep their visualisations up to date.
Google Data Studio
Google Data Studio, developed by Google, has gained significant popularity as a powerful and user-friendly data visualization and reporting platform. This article provides a comprehensive exploration of various aspects of Google Data Studio, covering crucial elements such as pricing structures, tutorials, dashboard capabilities, connectors for data sources, a comparative analysis with Tableau, reporting functionalities, available templates, training options, integration capabilities, and methods for downloading the platform.
Google Data Studio comparisons
A comparison between Google Data Studio and Tableau, another leading data visualisation tool, can help organisations choose the most suitable solution based on their specific requirements. While both tools offer powerful data visualisation capabilities, there are some notable differences:
Cost: Google Data Studio has a significant advantage in terms of cost, as it is free to use. Tableau, on the other hand, offers various pricing options, including both free and paid versions, with the paid versions having additional features and capabilities.
User Interface and Ease of Use: Google Data Studio has a user-friendly interface that is intuitive and easy to navigate, making it accessible to users with varying levels of technical expertise. Tableau, while also providing a user-friendly interface, may have a steeper learning curve, especially for users with limited experience in data visualisation tools.
Data Sources and Connectors: Google Data Studio offers a wide range of native connectors, including those for Google products, making it seamless to connect and visualise data from these sources. Tableau also provides extensive connectivity options but may require additional configurations or third-party connectors for some data sources.
Advanced Analytics and Functionality: Tableau has a more extensive set of advanced analytics capabilities, including predictive analytics, statistical modelling, and more advanced charting options. Google Data Studio, while improving in this area, is more focused on data visualisation and reporting functionalities.
Collaboration and Sharing: Both Google Data Studio and Tableau offer collaboration and sharing capabilities, allowing multiple users to work on reports and dashboards simultaneously. However, Google Data Studio has an advantage in terms of ease of sharing and collaboration, as it is tightly integrated with other Google Workspace tools like Google Drive and Google Sheets.
Add a Review to This Software
Conclusion
Alternative Software
Mode Analytics, developed by Mode Analytics Inc., stands out as a robust analytics solution that empowers users to efficiently explore, analyze, and visualize data. This article aims to comprehensively explore various dimensions of Mode Analytics, encompassing crucial elements such as pricing, reviews, tutorials, dashboard capabilities, features, data visualization capabilities, the implementation process, available training options, a comparative analysis with Tableau, and insights into the download process.
Logi Analytics, a prominent embedded analytics platform, equips organizations with tools to create interactive dashboards, reports, and visualizations that facilitate informed decision-making. This article will delve into various facets of Logi Analytics, encompassing essential elements such as pricing, reviews, tutorials, dashboard capabilities, features, data analytics functionalities, the implementation process, available training options, a comparative analysis with Tableau, and insights into the download process.


