Zoho Analytics, a robust business intelligence and analytics platform, plays a pivotal role in empowering businesses to unlock the full potential of their data. With its intuitive interface, powerful features, and comprehensive capabilities, Zoho Analytics enables users to analyze data, visualize trends, generate interactive reports, and derive actionable insights, ultimately contributing to business success. This article is designed to provide a deep dive into the realm of Zoho Analytics, exploring its key features, benefits, pricing options, use cases, and integration capabilities.
About JReport
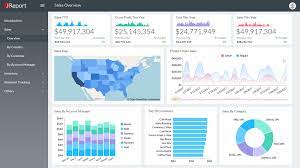
Featured Images
JReport Features
- Report Designer: JReport provides a powerful report designer that allows users to create pixel-perfect reports with ease. The designer offers a range of design elements, formatting options, and interactive components to enhance the visual appeal and interactivity of reports.
- Ad-hoc Reporting: JReport enables users to create ad-hoc reports on the fly, allowing them to explore data in real-time and generate insights quickly. Ad-hoc reporting empowers business users to perform self-service analysis without relying on IT or technical teams.
- Embedded Reporting: JReport supports embedding reports seamlessly into applications or web portals, providing a unified experience for end-users. This feature enables organisations to deliver information directly to the intended audience within the context of their existing applications.
- Data Drilling: JReport allows users to drill down into data at various levels of granularity, enabling them to explore underlying details and identify trends or patterns. The drill-down capability empowers users to gain a deeper understanding of their data and make informed decisions.
- Data Connectivity: JReport supports a wide range of data sources, including relational databases, OLAP cubes, web services, and more. This flexibility enables users to connect to multiple data sources, consolidate data, and analyse it in a unified manner.
JReport Dashboard
The platform provides a variety of visualisation options, including charts, graphs, tables, and maps. Users can customise these visualisations by selecting different colours, styles, and layouts to align with their reporting requirements or corporate branding. The drag-and-drop interface enables easy arrangement and organisation of visual elements within the dashboard.
JReport dashboards are highly interactive, allowing users to drill down into specific data points, apply filters, and perform ad-hoc analysis. Users can add interactive controls, such as dropdown menus or sliders, to enable viewers to explore the data themselves. This interactivity enhances user engagement and facilitates data exploration.
JReport Data Analytics
JReport supports various analytical functions, such as aggregations, calculations, filtering, and sorting, to transform raw data into meaningful information. Users can apply statistical functions and algorithms to analyse trends, perform forecasting, and identify outliers within their data.
The platform also offers OLAP (Online Analytical Processing) capabilities, enabling users to perform multidimensional analysis and drill down into hierarchies or dimensions. This feature facilitates in-depth analysis and enables users to gain a comprehensive understanding of their data.
Pricing
JReport Review
Users appreciate JReport’s intuitive user interface, which allows both technical and non-technical users to navigate and create reports effortlessly. The platform’s drag-and-drop interface, interactive visualisations, and flexible formatting options enable users to design professional reports quickly.
Furthermore, JReport offers advanced features such as ad-hoc reporting, data drilling, and embedding capabilities, allowing users to explore data at multiple levels of granularity and embed reports seamlessly into applications or web portals. The ability to customise report templates and styles ensures a consistent and branded look for all reports.
JReport
JReport, crafted by Jinfonet Software, emerges as a pivotal player in the contemporary data-centric business realm, offering an analytics and reporting solution designed to empower users in converting raw data into actionable insights. This comprehensive article aims to unravel various facets of JReport, spanning pricing insights, a critical review, tutorial prospects, dashboard capabilities, feature highlights, data analytics prowess, implementation processes, available training avenues, a comparative analysis with Tableau, and the download procedures. By navigating through these dimensions, readers gain a nuanced understanding of how JReport can serve as a potent tool in the data analytics toolkit, fostering informed decision-making and operational excellence for organizations.
JReport Implementation
Requirement Gathering: During the requirement gathering phase, organisations work closely with JReport consultants to define their analytics goals, data sources, reporting requirements, and integration needs. This step helps establish the scope of the implementation project.
Data Integration: JReport consultants assist organisations in integrating their data sources with the platform. This may involve connecting to databases, data warehouses, or other data repositories. The goal is to ensure that data is accessible for reporting and analysis within JReport.
Report Development: JReport consultants collaborate with organisations to develop reports and dashboards based on their specific requirements. This includes designing report templates, creating data models, and defining calculations and visualisations. The consultants ensure that the reports align with the organisation’s reporting standards and branding guidelines.
Deployment and Configuration: JReport consultants assist in deploying and configuring the JReport server and related components. This involves setting up security settings, user roles, and access permissions to ensure data governance and control.
User Training and Adoption: JReport consultants provide training sessions to educate users on how to leverage the platform effectively. These sessions cover various topics, such as report creation, dashboard design, and data exploration. Training ensures that users have the necessary skills to utilise JReport to its full potential.
Add a Review to This Software
Conclusion
The platform’s comprehensive tutorials, documentation, and training resources enable users to quickly get up to speed and maximise the value of JReport within their organisations. While JReport and Tableau have their own strengths and nuances, the choice between the two ultimately depends on the specific requirements, reporting needs, and technical preferences of the organisation.
Alternative Software
Mode Analytics, developed by Mode Analytics Inc., stands out as a robust analytics solution that empowers users to efficiently explore, analyze, and visualize data. This article aims to comprehensively explore various dimensions of Mode Analytics, encompassing crucial elements such as pricing, reviews, tutorials, dashboard capabilities, features, data visualization capabilities, the implementation process, available training options, a comparative analysis with Tableau, and insights into the download process.
Logi Analytics, a prominent embedded analytics platform, equips organizations with tools to create interactive dashboards, reports, and visualizations that facilitate informed decision-making. This article will delve into various facets of Logi Analytics, encompassing essential elements such as pricing, reviews, tutorials, dashboard capabilities, features, data analytics functionalities, the implementation process, available training options, a comparative analysis with Tableau, and insights into the download process.


