Zoho Analytics, a robust business intelligence and analytics platform, plays a pivotal role in empowering businesses to unlock the full potential of their data. With its intuitive interface, powerful features, and comprehensive capabilities, Zoho Analytics enables users to analyze data, visualize trends, generate interactive reports, and derive actionable insights, ultimately contributing to business success. This article is designed to provide a deep dive into the realm of Zoho Analytics, exploring its key features, benefits, pricing options, use cases, and integration capabilities.

- Interactive Dashboards: Power BI allows users to create interactive dashboards by consolidating data from multiple sources into a single view. This feature provides a holistic snapshot of key performance indicators (KPIs) and facilitates real-time monitoring.
- Data Visualization: With an extensive collection of pre-built data visualizations and customizable options, Power BI enables users to present data in visually compelling ways. The platform supports various chart types, maps, tables, and custom visuals to cater to diverse reporting needs.
- Natural Language Query: Power BI's natural language query feature allows users to ask questions about their data using plain English. This intuitive capability eliminates the need for complex coding or query languages and enables even non-technical users to extract insights effortlessly.
- Collaboration and Sharing: Power BI makes it easy to collaborate on reports and dashboards by allowing users to share and embed visualizations within their organization or with external stakeholders. This fosters a culture of data-driven decision-making and enhances communication across teams.
- Data Connectivity: Power BI offers seamless integration with a wide range of data sources, including cloud services, on-premises databases, Excel spreadsheets, and online services such as Salesforce and Google Analytics. This flexibility ensures that users can access and analyze data from multiple platforms.
- Tableau: Tableau is a leading data visualization and analytics platform known for its user-friendly interface, extensive data connectivity options, and powerful visual capabilities.
- QlikView: QlikView is a self-service data discovery and visualization tool that provides advanced analytics features, intuitive dashboards, and associative data indexing.
- Google Data Studio: Google Data Studio is a free web-based tool that enables users to create customizable reports and interactive dashboards using various data sources.
- IBM Cognos: IBM Cognos is a comprehensive business intelligence and performance management platform that offers a wide range of reporting, analysis, and planning capabilities.
- Business Analysts: Power BI empowers business analysts to derive insights from complex data sets, create interactive visualizations, and share reports with stakeholders.
- Data Scientists: Power BI’s advanced analytics capabilities enable data scientists to perform in-depth data exploration, predictive modeling, and machine learning tasks.
- Executives and Managers: Power BI’s dashboards and KPI monitoring features provide executives and managers with a real-time overview of business performance, facilitating informed decision-making.
- Power BI Free
Power BI Free: This plan allows users to create and share basic reports and dashboards for free. It includes 1 GB of data storage per user and allows data refresh once a day.
- Power BI Pro
Power BI Pro: Priced at $10 per user per month, Power BI Pro offers additional features such as live data streaming, collaboration and sharing capabilities, and scheduled data refresh up to eight times a day. It also provides 10 GB of data storage per user.
- Power BI Premium
Power BI Premium: Priced at $20 Per user/month. License individual users to accelerate access to insights with advanced AI, unlock self-service data prep for big data, and simplify data management and access at enterprise scale.
- Per capacity
Per capacity : from $4,995 Per capacity/month. License your organization with capacity to accelerate access to insights with advanced AI, unlock self-service data prep for big data, and simplify data management and access at enterprise scale—without per-user licenses for content consumers.
Microsoft provides comprehensive resources and tutorials to help users get started with Power BI. The official Power BI website offers a wealth of documentation, videos, and step-by-step guides covering various aspects of the tool. Additionally, Microsoft offers instructor-led training courses, virtual workshops, and online webinars to deepen users’ knowledge and proficiency in Power BI.
Microsoft Power BI Certification:
Microsoft offers certification programs to validate users’ expertise in Power BI. The Microsoft Certified: Data Analyst Associate certification demonstrates proficiency in data analysis and visualization using Power BI. This certification is highly regarded by employers and can enhance career prospects in the field of business intelligence.
Microsoft Power BI Dashboard:
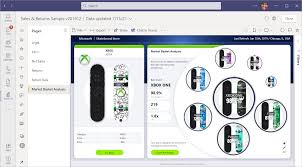
A key component of Power BI is the dashboard, which provides a consolidated view of data through interactive visualizations. Users can create custom dashboards by selecting relevant data elements, choosing visualizations, and arranging them in a meaningful layout. Power BI dashboards can be shared with others within the organization, enabling collaborative decision-making and data-driven insights.
Microsoft Power BI Report:
Power BI allows users to create reports that present data in a structured and visually appealing manner. Reports can include multiple visualizations, filters, and interactive elements. Users can drill down into the data, apply filters, and explore different perspectives to gain deeper insights. Power BI reports can be customized and shared with others, facilitating data-driven storytelling and effective communication.
Microsoft Power BI Download and Microsoft Power BI Desktop:
To start using Power BI, users can download Power BI Desktop, a Windows application that serves as the primary development tool. Power BI Desktop allows users to connect to data sources, create data models, design visualizations, and author reports. It provides advanced features and capabilities for data transformation, modeling, and analysis. Power BI Desktop is available as a free download from the official Power BI website.
Microsoft Power BI Consulting:
For organizations looking to implement Microsoft Power BI or enhance their existing Power BI capabilities, there are consulting services available. Microsoft Power BI consulting partners offer expertise in data modeling, visualization best practices, data governance, and implementation strategies. These consultants can assist organizations in maximizing the value of Power BI by providing tailored solutions, training, and support.

Microsoft Power BI stands as a multifaceted suite of business analytics tools meticulously crafted by Microsoft. This dynamic platform empowers users to seamlessly connect with diverse data sources, skillfully transform raw data into insightful visualizations, and effortlessly disseminate these valuable insights throughout the organization. Power BI's tripartite structure comprises Power BI Desktop, Power BI Service, and Power BI Mobile, offering a comprehensive and integrated approach to the entire analytics lifecycle. Unleash the full potential of your data, fostering informed decision-making and collaborative insights across your organizational landscape with Microsoft Power BI.
- Ease of Use: Power BI’s seamless integration with other Microsoft products and its user-friendly interface make it a popular choice. However, alternatives like Tableau also provide intuitive interfaces and extensive community support.
- Data Connectivity: Power BI offers robust connectivity options, allowing users to connect to a variety of data sources. Alternatives like Tableau and QlikView also provide comprehensive data connectivity capabilities.
- Advanced Analytics: Depending on the specific requirements of an organization, alternatives like Tableau and IBM Cognos may offer more advanced analytics features and capabilities.
Mode Analytics, developed by Mode Analytics Inc., stands out as a robust analytics solution that empowers users to efficiently explore, analyze, and visualize data. This article aims to comprehensively explore various dimensions of Mode Analytics, encompassing crucial elements such as pricing, reviews, tutorials, dashboard capabilities, features, data visualization capabilities, the implementation process, available training options, a comparative analysis with Tableau, and insights into the download process.
Logi Analytics, a prominent embedded analytics platform, equips organizations with tools to create interactive dashboards, reports, and visualizations that facilitate informed decision-making. This article will delve into various facets of Logi Analytics, encompassing essential elements such as pricing, reviews, tutorials, dashboard capabilities, features, data analytics functionalities, the implementation process, available training options, a comparative analysis with Tableau, and insights into the download process.


