
Zoho Analytics, a robust business intelligence and analytics platform, plays a pivotal role in empowering businesses to unlock the full potential of their data. With its intuitive interface, powerful features, and comprehensive capabilities, Zoho Analytics enables users to analyze data, visualize trends, generate interactive reports, and derive actionable insights, ultimately contributing to business success. This article is designed to provide a deep dive into the realm of Zoho Analytics, exploring its key features, benefits, pricing options, use cases, and integration capabilities.
About Pyramid Analytics
Featured Images
Pyramid Analytics features
- Data Integration: Pyramid Analytics supports integration with various data sources, including databases, data warehouses, cloud-based platforms, and business applications. This enables users to consolidate data from multiple sources, ensuring a unified view for analysis.
- Advanced Analytics: The platform provides advanced analytics capabilities, including predictive analytics, statistical modelling, and machine learning. These features enable organisations to uncover patterns, trends, and correlations in their data, facilitating predictive and prescriptive analytics.
- Self-Service Analytics: Pyramid Analytics emphasises self-service analytics, empowering business users to explore and analyse data without heavy reliance on IT departments. The intuitive interface and drag-and-drop functionality make it accessible to users with varying levels of technical expertise.
- Mobile Access: Pyramid Analytics provides mobile-friendly dashboards, enabling users to access and interact with data on-the-go. Whether using smartphones or tablets, users can stay connected to critical business insights from anywhere, at any time.
- Data Governance and Security: Pyramid Analytics prioritises data governance and security. The platform offers robust security features, including user access controls, data encryption, and audit trails, ensuring the protection of sensitive information.
Pyramid Analytics Data Analytics
- Exploratory Data Analysis: Pyramid Analytics enables users to explore data through interactive visualisations, filters, and drill-down capabilities. Users can examine data from different angles, identify outliers, and gain a comprehensive understanding of their data.
- Data Modeling and Preparation: The platform supports data modelling and preparation, allowing users to transform raw data into structured and actionable information. Users can perform data cleansing, transformation, and enrichment tasks to ensure the accuracy and reliability of their analytics.
- Predictive Analytics: The platform facilitates predictive analytics, allowing users to build and deploy predictive models on their data. Users can apply machine learning algorithms, perform regression analysis, and generate predictions to anticipate future outcomes.
- Data Storytelling: Pyramid Analytics enables users to create compelling narratives around their data through interactive reports and dashboards. Users can weave together visualisations, annotations, and insights to communicate their findings effectively.
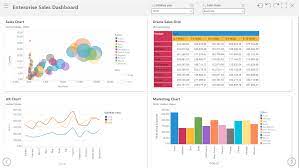
Pyramid Analytics Dashboard
Pyramid Analytics offers a wide range of visualisation options, including charts, graphs, maps, and gauges. Users can customise these visualisations with various formatting options, such as colours, fonts, and styles, to align with their branding or reporting requirements. The drag-and-drop interface allows for easy arrangement and organisation of visual elements within the dashboard, enabling users to design intuitive and user-friendly displays.
The interactive nature of Pyramid Analytics dashboards facilitates data exploration and analysis. Users can apply filters, drill down into data, and interact with visualisations to gain deeper insights. Additionally, the platform supports collaboration and sharing, allowing users to collaborate on dashboards, share insights, and enable cross-functional decision-making.
Pricing
The pricing for Pyramid Analytics typically depends on factors such as the number of users, required functionalities, and deployment options. Pyramid Analytics provides both cloud-based and on-premises deployment models. The cloud-based subscription model allows organisations to access Pyramid Analytics through a web browser without the need for infrastructure setup and maintenance. The on-premises deployment model provides organisations with complete control over the infrastructure and offers perpetual ownership of the software.
To obtain accurate pricing information for Pyramid Analytics, it is recommended to contact Pyramid Analytics directly. Their sales representatives can provide detailed pricing based on the specific requirements of your organisation.
Pyramid Analytics Implementation
- Requirements Gathering: During the requirements gathering phase, PyramidAnalytics consultants work closely with organisations to understand their analytics needs, existing data infrastructure, and desired outcomes. This step involves identifying key performance indicators (KPIs), data sources, and integration points.
- Infrastructure Setup: Pyramid Analytics can be deployed on-premises or in the cloud. Consultants help organisations set up the required infrastructure, configure security settings, and establish connectivity to data sources.
- User Training and Adoption: Pyramid Analytics consultants provide training sessions to educate users on how to effectively utilise the platform. These sessions cover topics such as data exploration, dashboard creation, and report generation. Training ensures that users are equipped with the necessary skills to leverage Pyramid Analytics effectively.
- Testing and Validation: Before going live, comprehensive testing is conducted to validate the accuracy and performance of the implemented solution. This includes testing data connections, dashboards, and reports to ensure they deliver the expected results.
Pyramid Analytics
Pyramid Analytics stands out as a powerful analytics platform, providing organizations with the means to unlock the true potential of their data. Developed by Pyramid Analytics, this robust solution empowers users to glean valuable insights and make informed decisions. This comprehensive article delves into various aspects of Pyramid Analytics, covering pricing, reviews, tutorials, dashboard capabilities, features, data analytics capabilities, implementation processes, training options, a comparison with Tableau, and details on the download process.
Pyramid Analytics comparisons
- Pricing and Licensing: Pyramid Analytics offers flexible pricing models, including both perpetual and subscription licensing options. Tableau also provides various pricing options, including perpetual and subscription licences, with additional features available in higher-tiered licences. The exact pricing for both platforms varies based on factors such as deployment scale and functionalities required.
- Advanced Analytics Capabilities: Tableau offers a comprehensive set of advanced analytics capabilities, including statistical modelling, predictive analytics, and advanced charting options. Pyramid Analytics provides advanced analytics capabilities as well, but it may require additional configurations or customization to match the breadth of Tableau’s offerings.
Add a Review to This Software
Conclusion
Alternative Software
Mode Analytics, developed by Mode Analytics Inc., stands out as a robust analytics solution that empowers users to efficiently explore, analyze, and visualize data. This article aims to comprehensively explore various dimensions of Mode Analytics, encompassing crucial elements such as pricing, reviews, tutorials, dashboard capabilities, features, data visualization capabilities, the implementation process, available training options, a comparative analysis with Tableau, and insights into the download process.
Logi Analytics, a prominent embedded analytics platform, equips organizations with tools to create interactive dashboards, reports, and visualizations that facilitate informed decision-making. This article will delve into various facets of Logi Analytics, encompassing essential elements such as pricing, reviews, tutorials, dashboard capabilities, features, data analytics functionalities, the implementation process, available training options, a comparative analysis with Tableau, and insights into the download process.


