
Zoho Analytics, a robust business intelligence and analytics platform, plays a pivotal role in empowering businesses to unlock the full potential of their data. With its intuitive interface, powerful features, and comprehensive capabilities, Zoho Analytics enables users to analyze data, visualize trends, generate interactive reports, and derive actionable insights, ultimately contributing to business success. This article is designed to provide a deep dive into the realm of Zoho Analytics, exploring its key features, benefits, pricing options, use cases, and integration capabilities.
About RapidMiner
Featured Images
RapidMiner features
- Data Preparation: RapidMiner provides a wide range of data preparation tools to clean, transform, and enrich datasets. Users can handle missing values, perform feature selection, handle outliers, and apply various data transformations to prepare data for analysis.
- Machine Learning: RapidMiner offers an extensive library of machine learning algorithms, including classification, regression, clustering, and association rule mining. Users can apply these algorithms to build accurate predictive models and uncover patterns and relationships in their data.
- Text Analytics: RapidMiner's text analytics capabilities enable organisations to extract insights from unstructured textual data. Users can perform tasks such as sentiment analysis, topic modelling , and text classification to gain valuable insights from text data sources.
- Model Deployment: RapidMiner allows users to deploy their predictive models into production environments, making it easier to integrate data-driven insights into operational processes. Models can be deployed as RESTful web services, enabling real-time predictions and automation of decision-making processes.
- Collaboration and Sharing: RapidMiner provides collaboration features that facilitate teamwork and knowledge sharing. Users can collaborate on projects, share workflows and models, and benefit from the collective expertise within their organisation.
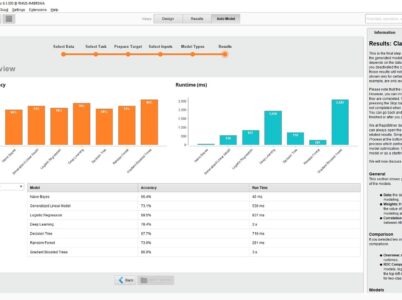
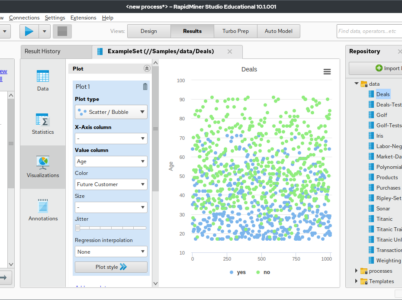
RapidMiner Dashboard
Users can select from a variety of visualisation components, such as charts, graphs, tables, and maps, to build informative and interactive dashboards. RapidMiner’s dashboard capabilities allow users to combine different visual elements, apply filters and drill-down functionality, and create dynamic visualisations that respond to user interactions.
RapidMiner Data Analytics
Descriptive analytics focuses on summarising historical data to gain insights into past trends and patterns. Users can apply statistical measures, create visualisations, and generate reports to understand the characteristics of their data.
Diagnostic analytics helps organisations understand the causes and factors behind specific outcomes. By analysing historical data, users can identify correlations, relationships, and root causes of events or phenomena.
Predictive analytics allows organisations to make data-driven predictions by building models that capture patterns and relationships in historical data. These models can be used to forecast future outcomes and identify potential risks or opportunities.
Prescriptive analytics goes beyond predictions and provides recommendations for optimal decision-making. By considering different scenarios and constraints, organisations can make data-informed decisions and optimise their processes.
Pricing
To obtain accurate pricing information, it is recommended to contact the RapidMiner sales team directly. They can provide detailed pricing based on the specific requirements and scale of your organisation.
RapidMiner Training
- RapidMiner Academy: RapidMiner Academy provides a variety of online courses and certifications for users of all skill levels. These courses cover topics such as data preparation, machine learning, text analytics, and model deployment. Users can learn at their own pace and earn certifications to demonstrate their expertise.
- On-Site Training: RapidMiner offers on-site training programs tailored to the specific needs of organisations. These programs can be customised to focus on the organisation’s use cases and data analysis requirements. On-site training allows organisations to train multiple users simultaneously and align the training with their internal processes.
- Online Resources: RapidMiner provides extensive documentation, tutorials, and community forums to support users in their learning journey. These resources offer step-by-step instructions, best practices, and real-world examples to help users leverage the full potential of RapidMiner.
RapidMiner
In the age of big data, organizations seek powerful tools to extract valuable insights from their vast datasets. RapidMiner, a prominent data science platform, empowers organizations to conduct advanced analytics, construct predictive models, and derive actionable insights. This article will comprehensively explore various facets of RapidMiner, encompassing aspects such as pricing, reviews, tutorials, dashboard capabilities, features, data analytics capabilities, implementation processes, training options, a comparison with Tableau, and the download process. The aim is to provide an in-depth understanding of RapidMiner's capabilities and functionalities.
RapidMiner vs Tableau
- Data Science vs Data Visualisation: RapidMiner focuses on data science and offers advanced capabilities for predictive modelling , machine learning, and data preparation. Tableau, on the other hand, excels in data visualisation and provides intuitive and interactive dashboards for visual exploration and storytelling.
- Workflow vs Drag-and-Drop Interface: RapidMiner’s visual workflow interface allows users to design complex analytical workflows, making it suitable for data scientists and analysts who require flexibility and customisation . Tableau’s drag-and-drop interface is more user-friendly and geared towards business users who want to create visually appealing dashboards without extensive coding.
- Predictive Analytics vs Business Intelligence: RapidMiner’s strength lies in its predictive analytics capabilities, allowing organisations to build accurate models and make data-driven predictions. Tableau focuses on business intelligence and offers powerful visualisations, ad hoc querying, and data exploration for gaining insights from data.
- Learning Curve: RapidMiner’s advanced analytics capabilities require a steeper learning curve compared to Tableau’s user-friendly interface. RapidMiner is more suitable for users with a background in data science or those willing to invest time in learning advanced analytical techniques. Tableau, on the other hand, is designed for a broader user base, including business users with limited technical skills.
- Pricing Model: RapidMiner’s pricing is based on various factors, including the number of users, functionality requirements, and deployment options. Tableau’s pricing structure is primarily based on a per-user or per-server basis. organisations should consider their budget, specific needs, and user base when evaluating the pricing models of both platforms.
Add a Review to This Software
Conclusion
Understanding the pricing, reviewing the platform’s capabilities, exploring tutorials and training options, comparing it with other analytics solutions like Tableau, and downloading the platform are crucial steps for organisations considering the adoption of RapidMiner. Whether it’s implementing RapidMiner, training users, building predictive models, or deploying analytics solutions, RapidMiner provides the necessary tools and resources to drive data-driven decision-making and unlock the full potential of data analysis.
Alternative Software
Mode Analytics, developed by Mode Analytics Inc., stands out as a robust analytics solution that empowers users to efficiently explore, analyze, and visualize data. This article aims to comprehensively explore various dimensions of Mode Analytics, encompassing crucial elements such as pricing, reviews, tutorials, dashboard capabilities, features, data visualization capabilities, the implementation process, available training options, a comparative analysis with Tableau, and insights into the download process.
Logi Analytics, a prominent embedded analytics platform, equips organizations with tools to create interactive dashboards, reports, and visualizations that facilitate informed decision-making. This article will delve into various facets of Logi Analytics, encompassing essential elements such as pricing, reviews, tutorials, dashboard capabilities, features, data analytics functionalities, the implementation process, available training options, a comparative analysis with Tableau, and insights into the download process.


