Zoho Analytics, a robust business intelligence and analytics platform, plays a pivotal role in empowering businesses to unlock the full potential of their data. With its intuitive interface, powerful features, and comprehensive capabilities, Zoho Analytics enables users to analyze data, visualize trends, generate interactive reports, and derive actionable insights, ultimately contributing to business success. This article is designed to provide a deep dive into the realm of Zoho Analytics, exploring its key features, benefits, pricing options, use cases, and integration capabilities.
About Tableau
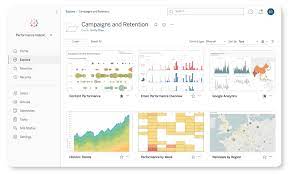
Featured Images
Tableau features
- Tableau Data Visualization: Tableau desktop provides a wide range of visualizations, including bar charts, line graphs, scatter plots, maps, and more. These visualizations can be customized with various formatting options, colors, and layouts to create engaging and informative dashboards.
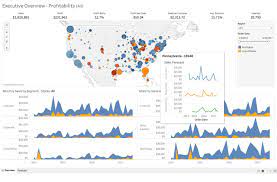
- Interactive Tableau Dashboards: With Tableau, users can create interactive dashboards by combining multiple visualizations into a single canvas. This allows for dynamic exploration of data, enabling users to drill down into specific details or filter data based on specific criteria.
- Data Blending and Integration: Tableau community has robust capabilities for blending and integrating data from multiple sources, such as spreadsheets, databases, and cloud services. This enables users to bring together disparate datasets and perform comprehensive analysis.
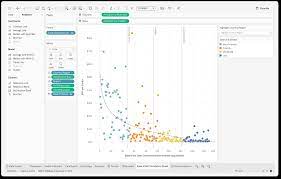
- Advanced Analytics: Tableau offers advanced analytics features, including statistical modeling, forecasting, clustering, and trend analysis. These capabilities enhance the depth of data analysis and provide actionable insights for decision-making.
- Collaboration and Sharing: Tableau allows users to collaborate on projects by sharing dashboards, reports, and data sources with team members. This promotes collaboration, knowledge sharing, and streamlines the decision-making process.
Tableau Alternative
- Power BI: Developed by Microsoft, Power BI is a comprehensive data visualization and analytics tool. It offers a wide range of visualizations, data connectors, and integration with other Microsoft products. Power BI is known for its seamless integration with Excel and strong collaboration features.
- QlikView: QlikView is a business intelligence and data visualization platform that focuses on associative data exploration. It enables users to quickly navigate through data and make discoveries based on relationships between data elements.
- Looker: Looker is a cloud-based data platform that combines data exploration, analytics, and visualization. It emphasizes data governance and offers robust collaboration and sharing capabilities.
- Domo: Domo is a cloud-based platform that provides a comprehensive suite of data visualization, reporting, and collaboration tools. It is known for its ease of use and intuitive interface.
Who is Tableau For?
- Data Analysts: Tableau simplifies data exploration, analysis, and visualization tasks, allowing data analysts to uncover trends, patterns, and outliers quickly. The platform’s interactive features enable analysts to dive deep into data and share insights with stakeholders effectively.
- Business Professionals: Tableau empowers business professionals to gain data-driven insights, track KPIs, and make informed decisions. The intuitive interface and visually appealing dashboards facilitate the understanding and interpretation of complex data.
- Data Scientists: Tableau’s advanced analytics capabilities make it a valuable tool for data scientists. It allows them to perform advanced statistical modeling, predictive analytics, and machine learning tasks. Data scientists can leverage Tableau’s robust features to explore data, build models, and communicate their findings effectively.
- Executives and Managers: Tableau provides executives and managers with a comprehensive view of organizational performance, enabling them to monitor key metrics, identify trends, and make data-driven decisions. The interactive dashboards and reports empower leaders to track progress, optimize operations, and drive business growth.
Pricing
- Tableau Creator
- Tableau Explorer
- Tableau Viewer
Pricing is not disclosed by the company yet. Contact the sales team directly to get a quick quote for your requirements.
Why Choose Tableau?
- Intuitive User Interface: Tableau’s drag-and-drop interface makes it accessible to users with varying levels of technical expertise. The visual and interactive nature of the platform simplifies complex data analysis tasks, eliminating the need for extensive coding or programming skills.
- Powerful Data Visualization: Tableau’s extensive range of visualizations and customization options empowers users to create visually stunning and impactful dashboards. This helps in effectively communicating data insights to both technical and non-technical stakeholders.
- Scalability and Performance: Tableau’s architecture is designed to handle large datasets and scale seamlessly as data volumes increase. Its efficient processing capabilities ensure fast and responsive visualizations, even when dealing with complex queries or calculations.
- Active Community and Support: Tableau boasts a vibrant and engaged community of users, offering a wealth of resources, forums, and knowledge-sharing platforms. The active community provides support, best practices, and innovative solutions to users at all levels of expertise.
Tableau
Tableau software, crafted by Tableau Software, stands as a powerful data visualization and business intelligence tool. It empowers users to convert intricate data sets into interactive, visually compelling dashboards, reports, and infographics. Whether you're a data analyst, business professional, or a data enthusiast, Tableau provides an intuitive platform for exploring, analyzing, and effectively communicating data insights.
Tableau comparisons
- Power BI:
– Features: Power BI offers a wide range of data visualization options, including interactive dashboards, reports, and data exploration. It provides advanced analytics capabilities, AI-powered insights, and natural language query options. Power BI also offers robust data modeling and transformation capabilities.
– Ease of Use: Power BI has a user-friendly interface with a drag-and-drop functionality for creating visualizations. It integrates well with other Microsoft products, making it familiar to users of Excel and other Microsoft tools.
– Integration: Power BI has strong integration capabilities with other Microsoft tools, such as Excel, Azure, and SQL Server. It also supports integration with third-party applications and data sources.
- QlikView:
– Features: QlikView focuses on associative data indexing, enabling users to explore data relationships easily. It offers interactive and visually appealing dashboards, data discovery, and advanced analytics capabilities. QlikView provides powerful data modeling and scripting functionalities.
– Ease of Use: QlikView has a user-friendly interface, allowing users to create visualizations and explore data without extensive technical knowledge. Its associative data model simplifies data exploration and analysis.
– Integration: QlikView supports integration with various data sources, including databases, spreadsheets, and web applications. It also offers APIs for integration with third-party systems.
- Looker:
– Features: Looker is a cloud-based data platform that offers data exploration, visualization, and embedded analytics. It provides advanced analytics capabilities, including predictive modeling and machine learning. Looker emphasizes collaborative data exploration and sharing.
– Ease of Use: Looker has a user-friendly interface with a focus on self-service analytics. It offers an intuitive query language and a centralized modeling layer for data consistency. Looker also provides a robust set of customization options.
– Integration: Looker supports integration with various data sources, databases, and cloud platforms. It also offers APIs and SDKs for custom integrations and embedding analytics into other applications.
Add a Review to This Software
Conclusion
While Tableau’s pricing varies based on the specific requirements and the chosen licensing model, it offers flexible options to suit different budgets and user needs. Moreover, Tableau’s alternatives, such as Power BI, QlikView, Looker, and Domo, provide viable options for organizations seeking alternative solutions.
Ultimately, the choice between Tableau and its alternatives depends on individual preferences, organizational requirements, and the specific goals of data visualization and analysis projects. Regardless of the choice, the importance of selecting a tool that aligns with your needs cannot be understated. With the right tool at your disposal, you can harness the power of data and drive informed decision-making in today’s data-driven world.
Alternative Software
Mode Analytics, developed by Mode Analytics Inc., stands out as a robust analytics solution that empowers users to efficiently explore, analyze, and visualize data. This article aims to comprehensively explore various dimensions of Mode Analytics, encompassing crucial elements such as pricing, reviews, tutorials, dashboard capabilities, features, data visualization capabilities, the implementation process, available training options, a comparative analysis with Tableau, and insights into the download process.
Logi Analytics, a prominent embedded analytics platform, equips organizations with tools to create interactive dashboards, reports, and visualizations that facilitate informed decision-making. This article will delve into various facets of Logi Analytics, encompassing essential elements such as pricing, reviews, tutorials, dashboard capabilities, features, data analytics functionalities, the implementation process, available training options, a comparative analysis with Tableau, and insights into the download process.


