Zoho Analytics, a robust business intelligence and analytics platform, plays a pivotal role in empowering businesses to unlock the full potential of their data. With its intuitive interface, powerful features, and comprehensive capabilities, Zoho Analytics enables users to analyze data, visualize trends, generate interactive reports, and derive actionable insights, ultimately contributing to business success. This article is designed to provide a deep dive into the realm of Zoho Analytics, exploring its key features, benefits, pricing options, use cases, and integration capabilities.
About Klipfolio
With Klipfolio, users can connect to a wide range of data sources, including spreadsheets, databases, web services, and cloud-based applications. The platform offers a drag-and-drop interface and a library of pre-built data visualizations (called Klips) that can be customized and combined to create personalized dashboards.
Users can create interactive charts, graphs, tables, and other visual elements to display their data. Klipfolio provides various data manipulation and transformation options, such as calculations, filtering, and conditional formatting, to help users derive meaningful insights from their data.
The platform also supports collaboration, allowing multiple users to work together on dashboards and share them with team members. Users can set up automatic data refreshes, schedule reports, and receive notifications based on predefined triggers.
Overall, Klipfolio is designed to enable individuals and teams to monitor, analyze, and visualize data in a user-friendly and customizable manner, empowering data-driven decision-making within organizations.
Featured Images
Klipfolio Features
- Extensive Data Connectivity: Klipfolio supports integration with various data sources, including spreadsheets, databases, web services, and popular cloud platforms, ensuring that users can access and consolidate their data from diverse sources.
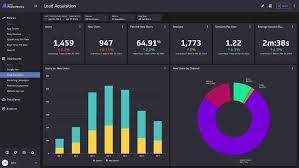
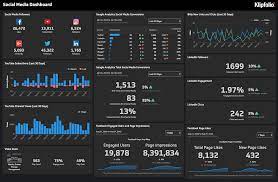
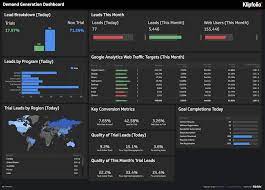
- Visual klipfolio Dashboard Builder: The platform offers a user-friendly dashboard builder with a vast library of pre-built components and visualizations. Users can easily customize and arrange their dashboards to suit their specific requirements.
- ClicData data analytics: Klipfolio provides a wide range of data visualization options, such as charts, tables, gauges, maps, and more. Users can create dynamic and interactive visualizations to present their data in a meaningful and engaging manner.
- Data Transformation and Calculation: Klipfolio allows users to transform and manipulate their data using various mathematical and logical functions. This feature enables users to derive insights and perform calculations directly within the platform.
- ClicData implementation: With real-time data connectivity, Klipfolio ensures that users can monitor their data and key metrics in real-time, enabling timely decision-making and immediate response to changing business conditions.
Klipfolio Alternatives
- Tableau: Tableau is a widely used business intelligence and data visualization tool. It offers powerful analytics capabilities, interactive dashboards, and advanced data exploration options.
- Power BI: Power BI is a business analytics tool by Microsoft. It provides robust data visualization, self-service analytics, and easy integration with other Microsoft products.
- Google Data Studio: Google Data Studio is a free data visualization tool that allows users to create interactive dashboards and reports. It integrates well with other Google products and offers collaboration features.
- Looker: Looker is a data platform that offers business intelligence, data exploration, and analytics capabilities. It provides a user-friendly interface and allows users to build custom dashboards and reports.
- Domo: Domo is a cloud-based platform that combines data visualization, analytics, and collaboration features. It offers a wide range of connectors to various data sources and provides real-time data insights.
- Sisense: Sisense is a business intelligence software that focuses on data integration, analytics, and visualization. It offers an easy-to-use interface and allows users to create interactive dashboards and reports.
These are just a few examples of the many alternatives available in the market. The choice of the best alternative depends on your specific requirements, budget, and preferences. It’s recommended to evaluate multiple options and consider factors such as ease of use, scalability, integrations, and pricing before making a decision.
Who Is Klipfolio For?
Klipfolio is suitable for various roles within an organization, including executives, managers, analysts, and data-driven professionals. It caters to individuals and teams who require data visualization and analytics to track metrics, monitor performance, and make data-driven decisions.
The platform is flexible and can be used across different industries, such as marketing, sales, finance, operations, human resources, and more. It enables users to connect to various data sources, including spreadsheets, databases, web services, and cloud-based applications, allowing them to aggregate and display data in a visually appealing and meaningful way.
Overall, Klipfolio is for anyone who wants to leverage data to gain insights, track progress, and drive business performance.
Pricing
FREE
- Free Plan
Details:
Free Plan : Pricing starts at $0
90.00 / month
- Go Plan
Details:
Go Plan : Pricing starts at $90
255.00 / month
- Pro Plan
Details:
Pro Plan : Pricing starts at $225
800.00 / month
- Business Plan
Details:
Business Plan : Annual plans starting at $800
Why Choose Klipfolio?
- Ease of Use: Klipfolio’s intuitive interface and drag-and-drop functionality make it accessible to users of all skill levels. No coding or technical expertise is required to create stunning dashboards.ClicData download is also a very easy and quick process.
- Flexibility and Customization: The platform provides extensive customization options, allowing users to tailor their dashboards to match their unique requirements. Users can choose from a wide range of visualization components and easily configure them according to their data and design preferences.
- Collaboration and Sharing: Klipfolio enables seamless collaboration among team members by allowing them to share dashboards, reports, and data visualizations. This feature promotes data-driven decision-making and fosters a culture of transparency and knowledge sharing within organizations.
Klipfolio
In the realm of business intelligence and data analytics, Klipfolio stands out as a cloud-based platform that empowers users to construct personalized dashboards and monitor key performance indicators (KPIs) in real-time. This platform facilitates a visual and interactive approach to tracking metrics, analyzing data, and gaining insights into business performance.
Klipfolio supports connectivity to a diverse array of data sources, including spreadsheets, databases, web services, and cloud-based applications. Its user-friendly drag-and-drop interface and a library of pre-built data visualizations, referred to as Klips, enable users to create customized dashboards.
Klipfolio comparisons
- User Interface and Ease of Use:
– Klipfolio: Klipfolio offers a user-friendly drag-and-drop interface, making it easy for users to create and customize visualizations without coding knowledge.
– Tableau: Tableau also provides a user-friendly interface and offers various options for creating visualizations. However, it may have a steeper learning curve compared to Klipfolio, particularly for complex analyses and advanced features.
- Data Sources and Connectivity:
– Klipfolio: Klipfolio supports a wide range of data sources, including spreadsheets, databases, cloud services, and web APIs. It offers native integrations with popular platforms such as Google Analytics, Salesforce, and more.
– Tableau: Tableau also supports numerous data sources, including databases, spreadsheets, cloud services, and big data platforms. It provides robust connectivity options and offers extensive data source compatibility.
- Visualizations and Dashboarding:
– Klipfolio: Klipfolio focuses on building interactive dashboards with key performance indicators (KPIs), charts, tables, and custom visualizations. It emphasizes real-time data monitoring and allows users to create visually appealing and dynamic dashboards.
– Tableau: Tableau is renowned for its powerful visualizations and flexibility in creating interactive dashboards. It provides a vast library of pre-built visualizations and advanced features, such as drill-downs, filters, and complex calculations.
- Collaboration and Sharing:
– Klipfolio: Klipfolio enables real-time collaboration, allowing users to share dashboards, reports, and data with team members. It provides options for scheduled email reports and supports embedding visualizations on websites or intranets.
– Tableau: Tableau offers collaborative features, including shared workbooks and dashboards, commenting, and user permissions. It also provides web-based publishing and allows embedding visualizations in other applications.
Add a Review to This Software
Conclusion
While Klipfolio is a robust option, it’s essential to consider alternative platforms like Tableau, which offer more advanced analytics capabilities and cater to larger-scale data requirements. The final choice between Klipfolio and Tableau depends on the specific needs, budget, and complexity of the data analysis and visualization tasks at hand.
In conclusion, Klipfolio stands as a reliable and user-friendly platform for businesses and individuals looking to leverage the power of data visualization and dashboard creation to drive informed decision-making and gain insights into their data-driven strategies.
Alternative Software
Mode Analytics, developed by Mode Analytics Inc., stands out as a robust analytics solution that empowers users to efficiently explore, analyze, and visualize data. This article aims to comprehensively explore various dimensions of Mode Analytics, encompassing crucial elements such as pricing, reviews, tutorials, dashboard capabilities, features, data visualization capabilities, the implementation process, available training options, a comparative analysis with Tableau, and insights into the download process.
Logi Analytics, a prominent embedded analytics platform, equips organizations with tools to create interactive dashboards, reports, and visualizations that facilitate informed decision-making. This article will delve into various facets of Logi Analytics, encompassing essential elements such as pricing, reviews, tutorials, dashboard capabilities, features, data analytics functionalities, the implementation process, available training options, a comparative analysis with Tableau, and insights into the download process.


