Zoho Analytics, a robust business intelligence and analytics platform, plays a pivotal role in empowering businesses to unlock the full potential of their data. With its intuitive interface, powerful features, and comprehensive capabilities, Zoho Analytics enables users to analyze data, visualize trends, generate interactive reports, and derive actionable insights, ultimately contributing to business success. This article is designed to provide a deep dive into the realm of Zoho Analytics, exploring its key features, benefits, pricing options, use cases, and integration capabilities.
About Looker
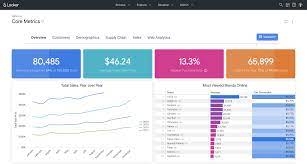
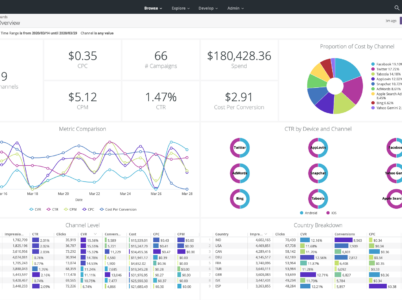
Featured Images
Looker features
- Intuitive Dashboard: Looker's dashboard is highly customizable, enabling users to create personalized data visualizations and interactive reports. The drag-and-drop interface makes it easy to design visually appealing Looker dashboards tailored to specific business requirements.
- Data Exploration and Looker Data Analytics: Looker offers a user-friendly interface for exploring data, allowing users to drill down into various dimensions and metrics. It provides an extensive range of data analysis functionalities, including filtering, pivoting, and aggregating, to uncover valuable insights.
- LookML Modeling Language: LookML is Looker's proprietary modeling language, which enables users to define and customize data models. This feature simplifies the data modeling process and allows for efficient collaboration among teams, ensuring data consistency across the organization.
- Looker Integration and Sharing: Looker facilitates collaboration by allowing users to share dashboards, reports, and data insights with team members. Real-time collaboration features enable users to work together, discuss findings, and make data-driven decisions collectively.
- Embedded Analytics: Looker's embedded analytics capabilities enable businesses to integrate data visualizations and reports seamlessly into their existing applications or websites. This empowers organizations to deliver data insights directly to their customers, partners, or internal stakeholders, enhancing the overall user experience.
Looker Alternatives
- Tableau: Tableau is a well-established data visualization and analytics tool known for its user-friendly interface and robust features. It offers a wide range of data visualization options and provides seamless integration with various data sources.
- Power BI: Developed by Microsoft, Power BI is a widely used business intelligence tool. It offers intuitive data exploration, interactive dashboards, and robust reporting capabilities. Power BI integrates well with other Microsoft products and services.
- QlikView: QlikView is a powerful data discovery and visualization platform. It allows users to explore data through associative analytics, enabling them to make connections and gain insights from multiple data sources.
- Domo: Domo is a cloud-based analytics platform that provides a unified view of business data. It offers interactive dashboards, data integration capabilities, and collaboration features to help organizations make data-driven decisions.
Who Is Looker For?
Looker is typically used by data analysts, business intelligence professionals, and decision-makers within companies across various industries. It enables users to connect to multiple data sources, transform raw data into meaningful insights, and collaborate with others by sharing reports and visualizations.
Pricing
- Standard edition : $5,000/month
- Enterprise edition : Customised solutions
- Embed platform : Customised solutions
User Licensing Fees
- Viewer User : $30 per user per month
- Standard User : $60 per user per month
- Developer User : $125 per user per month
Why Choose Looker?
- User-Friendly Interface: Looker’s intuitive interface makes it accessible to users of all skill levels, eliminating the need for extensive coding knowledge. This empowers business users to explore data and derive insights without relying heavily on IT or data teams. Looker download is also a very easy and quick process.
- Flexible and Scalable: Looker’s architecture is designed to handle large-scale data analytics requirements. It can efficiently process and analyze vast amounts of data, making it suitable for organizations with diverse data needs.
- Seamless Integration: Looker offers seamless integration with various data sources, including popular databases, data warehouses, and cloud platforms. This enables businesses to leverage their existing data infrastructure and integrate Looker into their data ecosystem effortlessly.
- Extensive Customization: Looker’s LookML modeling language allows for extensive customization, empowering organizations to tailor the platform to their specific data models and business requirements. This flexibility ensures that Looker can adapt to the unique needs of each organization.
Looker
Looker emerges as a versatile software platform, empowering businesses to seamlessly access, analyze, and visualize their data, unraveling actionable insights. With a user-friendly interface, Looker facilitates the exploration of data and the creation of interactive reports and dashboards. This platform enables organizations to establish connections with diverse data sources, skillfully transforming raw data into meaningful and actionable information. Looker fosters collaboration by facilitating the sharing of data visualizations and reports. Tailored to facilitate data-driven decision-making, Looker proves instrumental in unveiling valuable insights from the intricacies of organizational data.
Looker comparisons
- User Interface and Visualization: Tableau has a more user-friendly and intuitive interface with drag-and-drop capabilities, making it easier for non-technical users to create visualizations. Looker, on the other hand, has a more code-centric approach, where users write LookML (Looker Modeling Language) to define data models and visualizations.
- Data Modeling and Transformation: Looker has a strong focus on data modeling and transformation. It provides a modeling layer that allows users to define relationships between tables, create derived fields, and perform advanced calculations. Tableau, while it also offers data transformation capabilities, is more focused on visualization and analysis.
- Deployment Options: Looker is primarily a cloud-based platform and offers a Software-as-a-Service (SaaS) model. It provides a hosted environment where users can access and work with their data. Tableau, on the other hand, offers both cloud-based and on-premises deployment options, giving users more flexibility in choosing where to store and manage their data.
- Collaboration and Sharing: Both Looker and Tableau provide collaboration and sharing features. Looker allows users to create and share dashboards, reports, and data models with other team members. It also offers collaborative features like commenting and annotations. Tableau, known for its strong visualization capabilities, offers robust sharing options, including interactive dashboards and storyboards, which can be shared via Tableau Server or Tableau Public.
- Integration and Connectivity: Looker and Tableau can connect to a wide range of data sources, including databases, cloud services, and APIs. Looker has a native integration with Google BigQuery and supports SQL-based connections. Tableau, on the other hand, offers a large number of connectors and integrations, making it easier to connect to various data sources and systems.
- Customization and Extensibility: Looker provides a powerful modeling language (LookML) that allows users to customize and extend the platform’s functionality. LookML enables users to define reusable data models, create complex calculations, and define custom visualizations. Tableau, while it doesn’t have a dedicated modeling language, offers a range of customization options through its calculated fields, parameters, and scripting options.
Ultimately, the choice between Looker and Tableau depends on your specific needs, preferences, and the skill set of your team. If you value data modeling and transformation capabilities, Looker might be a better fit. If you prefer a user-friendly interface and strong visualization features, Tableau might be a more suitable choice.
Add a Review to This Software
Conclusion
Alternative Software
Mode Analytics, developed by Mode Analytics Inc., stands out as a robust analytics solution that empowers users to efficiently explore, analyze, and visualize data. This article aims to comprehensively explore various dimensions of Mode Analytics, encompassing crucial elements such as pricing, reviews, tutorials, dashboard capabilities, features, data visualization capabilities, the implementation process, available training options, a comparative analysis with Tableau, and insights into the download process.
Logi Analytics, a prominent embedded analytics platform, equips organizations with tools to create interactive dashboards, reports, and visualizations that facilitate informed decision-making. This article will delve into various facets of Logi Analytics, encompassing essential elements such as pricing, reviews, tutorials, dashboard capabilities, features, data analytics functionalities, the implementation process, available training options, a comparative analysis with Tableau, and insights into the download process.


