Zoho Analytics, a robust business intelligence and analytics platform, plays a pivotal role in empowering businesses to unlock the full potential of their data. With its intuitive interface, powerful features, and comprehensive capabilities, Zoho Analytics enables users to analyze data, visualize trends, generate interactive reports, and derive actionable insights, ultimately contributing to business success. This article is designed to provide a deep dive into the realm of Zoho Analytics, exploring its key features, benefits, pricing options, use cases, and integration capabilities.
About QlikView
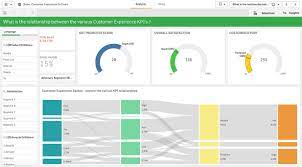
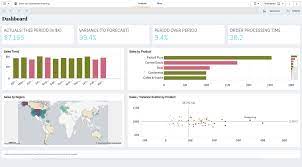
Featured Images
QlikView features
- QlikView Data Visualization: QlikView offers an extensive range of visualizations, including charts, graphs, tables, and maps, enabling users to present data in a visually appealing and easily understandable manner.
- Interactive Dashboards: Users can create interactive dashboards that consolidate multiple visualizations into a single view, facilitating comprehensive data analysis and quick decision-making.
- Associative Data Model: QlikView's unique associative data model allows users to explore data relationships intuitively. This feature enables users to make ad-hoc associations between data elements on the fly, uncovering unexpected insights.
- Robust Data Integration: QlikView supports integration with various data sources, including databases, spreadsheets, and enterprise systems, allowing users to seamlessly combine and analyze data from multiple sources.
- Collaboration and Sharing: QlikView enables users to share their insights and dashboards with colleagues through interactive collaboration features. This fosters teamwork and encourages knowledge sharing within organizations.
QlikView Alternatives
- Tableau: Tableau is one of the leading data visualization tools in the market. It provides a user-friendly interface and powerful visual analytics capabilities for exploring and presenting data.
- Power BI: Power BI is a business analytics tool developed by Microsoft. It enables users to create interactive reports and dashboards, perform data modeling, and share insights across organizations.
- Looker: Looker is a cloud-based data platform that offers data exploration, visualization, and embedded analytics. It provides a modern and intuitive interface for building and sharing data insights.
- Domo: Domo is a cloud-based platform that combines data integration, visualization, and collaboration features. It allows users to connect to various data sources, create interactive dashboards, and collaborate on data analysis.
- Sisense: Sisense is a business intelligence software that allows users to prepare, analyze, and visualize complex datasets. It offers a drag-and-drop interface and powerful data modeling capabilities.
- MicroStrategy: MicroStrategy is a comprehensive enterprise analytics platform that supports interactive dashboards, ad hoc queries, and advanced analytics. It provides a wide range of features for data discovery and exploration.
- Dundas BI: Dundas BI is a flexible and customizable business intelligence platform. It offers powerful data visualization capabilities, interactive dashboards, and advanced analytics options.
- Google Data Studio: Google Data Studio is a free data visualization tool that allows users to create interactive reports and dashboards using various data sources. It is a cloud-based solution with collaboration features.
These alternatives vary in terms of features, pricing, and deployment options. It’s recommended to evaluate your specific requirements and consider factors such as ease of use, scalability, integrations, and cost before choosing the most suitable alternative for your needs.
Who is QlikView for?
- Business Analysts: QlikView empowers business analysts to analyze and visualize data without relying on IT departments, enabling quicker insights and reducing dependency.
- Data Scientists: With its powerful analytical capabilities, QlikView serves as a valuable tool for data scientists, allowing them to explore complex data sets and generate actionable insights.
- Decision-makers: Executives and managers benefit from QlikView’s intuitive visualizations, which provide a holistic view of key metrics and facilitate data-driven decision-making.
Pricing
- Qlik Sense® Business Plan : $30/mo Per user. Billed annually.
- Qlik Sense Enterprise SaaS Plan : Get a Quote by contacting the team directly.
Why Choose QlikView?
- Intuitive User Interface: QlikView download user-friendly interface makes it accessible to both technical and non-technical users, allowing for widespread adoption within organizations.
- Powerful Data Analysis Capabilities: The software’s associative data model and comprehensive visualization options enable users to derive deep insights from their data, leading to better decision-making.
- QlikView consulting and Support: QlikView offers comprehensive training programs and resources to help users master the software. These training options cater to users with varying levels of expertise, ensuring that everyone can maximize their usage of QlikView.
QlikView
QlikView, developed by Qlik, stands as a prominent business intelligence and data visualization platform. This software empowers users to transform raw data into interactive visualizations and dynamic QlikView dashboards. With user-friendly interfaces, QlikView facilitates effortless data exploration and analysis. The platform proves instrumental in uncovering hidden patterns, trends, and relationships within data, supported by QlikView training and tutorials. This article provides an in-depth exploration of QlikView, encompassing various aspects such as features, training, pricing, tutorials, and more.
QlikView comparisons
- QlikView:
– Strengths: QlikView has a powerful associative data model that allows users to explore data intuitively and make dynamic associations. It provides robust data visualization capabilities and offers a range of chart types and interactive features. QlikView also supports complex data transformations and calculations.
– Weaknesses: QlikView can be more complex to set up and maintain compared to some other alternatives. It may require more technical expertise for implementation and administration. The user interface is considered less user-friendly and modern compared to some competitors.
- Tableau:
– Strengths: Tableau has a highly intuitive and user-friendly interface, making it accessible to both technical and non-technical users. It offers a wide variety of visualization options, including interactive dashboards, charts, and maps. Tableau has a large user community and extensive online resources for learning and support.
– Weaknesses: Tableau’s pricing can be relatively high, especially for enterprise-level deployments. Advanced features and functionalities may require additional licensing or add-ons. Tableau’s data preparation capabilities are not as strong as QlikView’s.
- Power BI:
– Strengths: Power BI is tightly integrated with other Microsoft products, making it a popular choice for organizations already using the Microsoft ecosystem. It offers seamless connectivity to various data sources and strong data modeling capabilities. Power BI is known for its ease of use and has a growing library of pre-built visuals and custom visuals.
– Weaknesses: Power BI’s data exploration and discovery features are not as advanced as QlikView’s. It may require more manual intervention and data modeling for complex analysis. Power BI’s collaboration features are not as robust as some other alternatives.
- Looker:
– Strengths: Looker is a cloud-based platform that offers powerful data exploration and visualization capabilities. It has a modern and intuitive interface that allows users to create and share interactive dashboards easily. Looker also provides strong data modeling and transformation capabilities.
– Weaknesses: Looker’s pricing model is based on a user-based license, which may not be cost-effective for organizations with a large user base. It may require additional development and customization for advanced analytics and complex data integrations.
- Sisense:
– Strengths: Sisense is known for its fast and efficient data processing capabilities, enabling users to analyze large volumes of data quickly. It provides a drag-and-drop interface for data modeling and offers a range of visualization options. Sisense also supports embedding analytics into other applications.
– Weaknesses: Sisense’s user interface can be less intuitive and less visually appealing compared to some other alternatives. Advanced analytics and predictive modeling capabilities may require additional plugins or custom development.
Add a Review to This Software
Conclusion
While considering the pricing of QlikView, it’s important to evaluate individual business requirements and compare them to alternatives like Tableau, Power BI, and Looker. Each software solution has its unique strengths, and businesses should assess their specific needs to determine the best fit.
Ultimately, QlikView’s positive user reviews and its track record of enabling data-driven decision-making highlight its value as a trusted partner in the world of data analytics. By leveraging QlikView’s features, organizations can gain a competitive edge by uncovering actionable insights and accelerating their growth in today’s data-driven landscape.
Alternative Software
Mode Analytics, developed by Mode Analytics Inc., stands out as a robust analytics solution that empowers users to efficiently explore, analyze, and visualize data. This article aims to comprehensively explore various dimensions of Mode Analytics, encompassing crucial elements such as pricing, reviews, tutorials, dashboard capabilities, features, data visualization capabilities, the implementation process, available training options, a comparative analysis with Tableau, and insights into the download process.
Logi Analytics, a prominent embedded analytics platform, equips organizations with tools to create interactive dashboards, reports, and visualizations that facilitate informed decision-making. This article will delve into various facets of Logi Analytics, encompassing essential elements such as pricing, reviews, tutorials, dashboard capabilities, features, data analytics functionalities, the implementation process, available training options, a comparative analysis with Tableau, and insights into the download process.


